
Reportsï
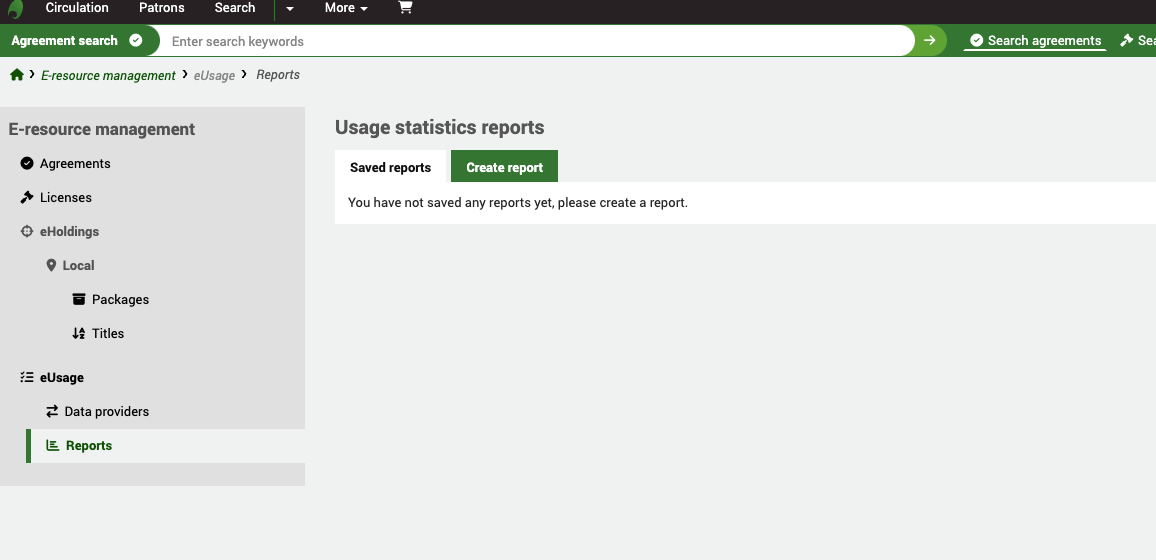
From the ERM Home page click on the Reports link in the left-hand menu.
Get there: More > E-resource management > Reports
Click the âCreate Reportâ tab to create a new report.
On the Reports home page, you will see a list of any âSaved reportsâ and also the ability to âCreate reportâ.
Create reportï
Usage statistics reports are located under the ERM module rather than the general Koha reporting module because of the unique nature of the statistical data.
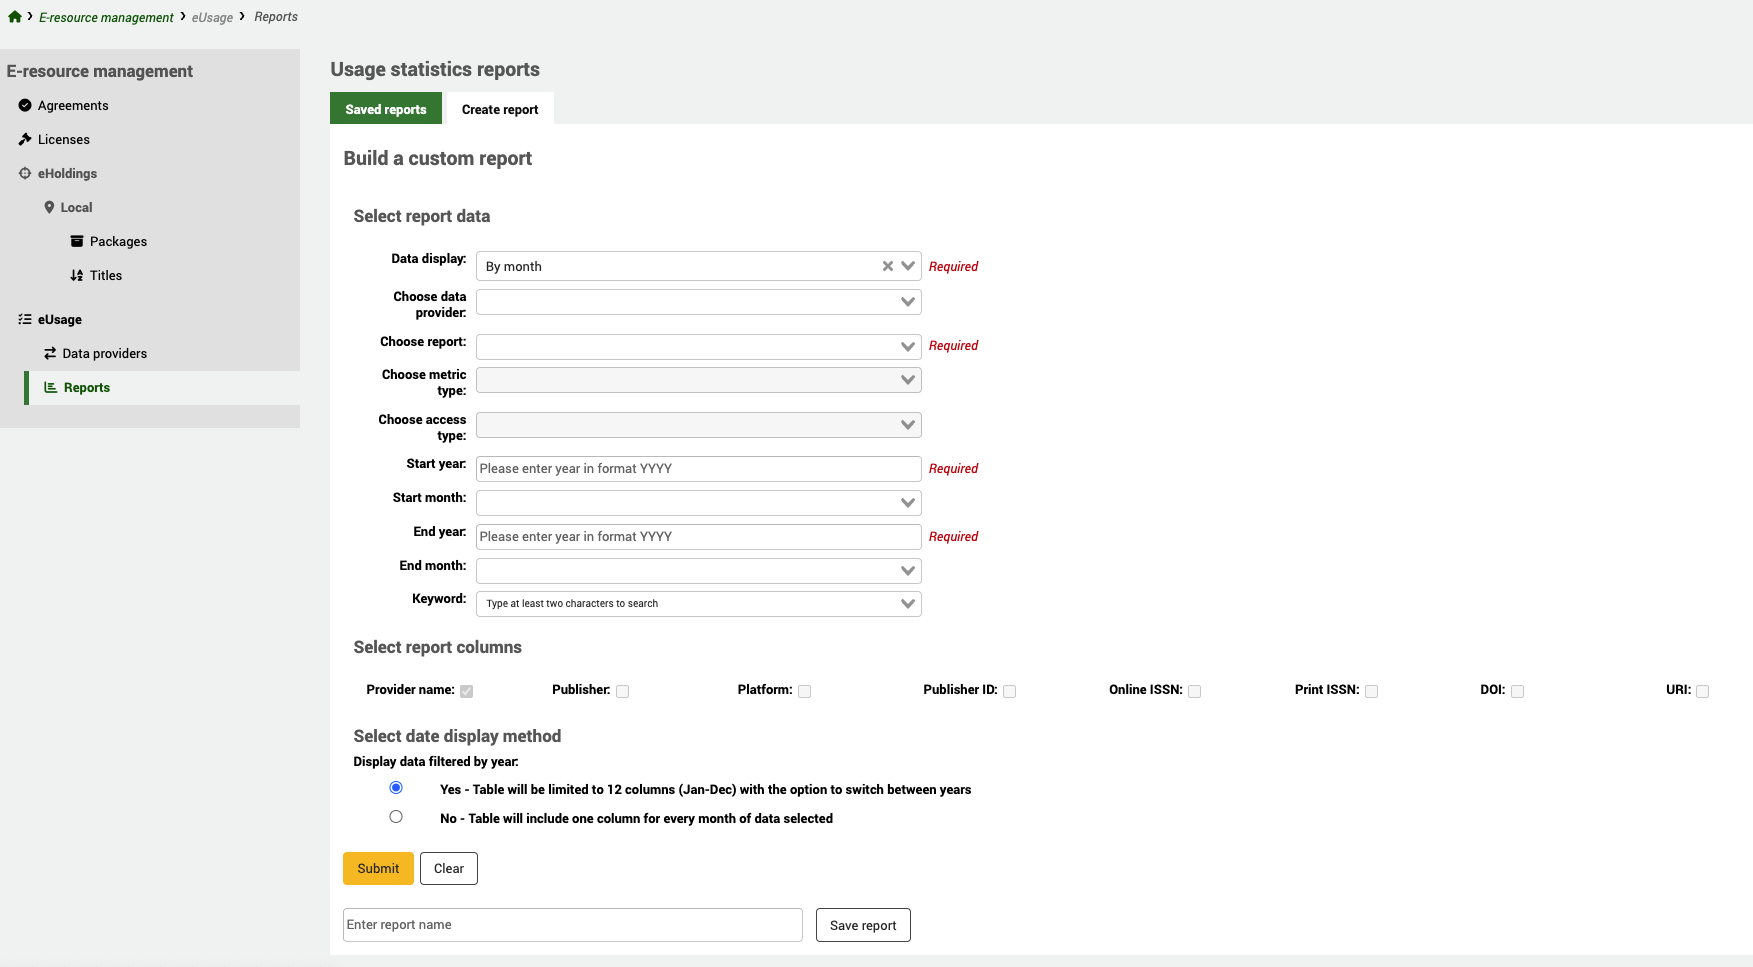
Select report dataï
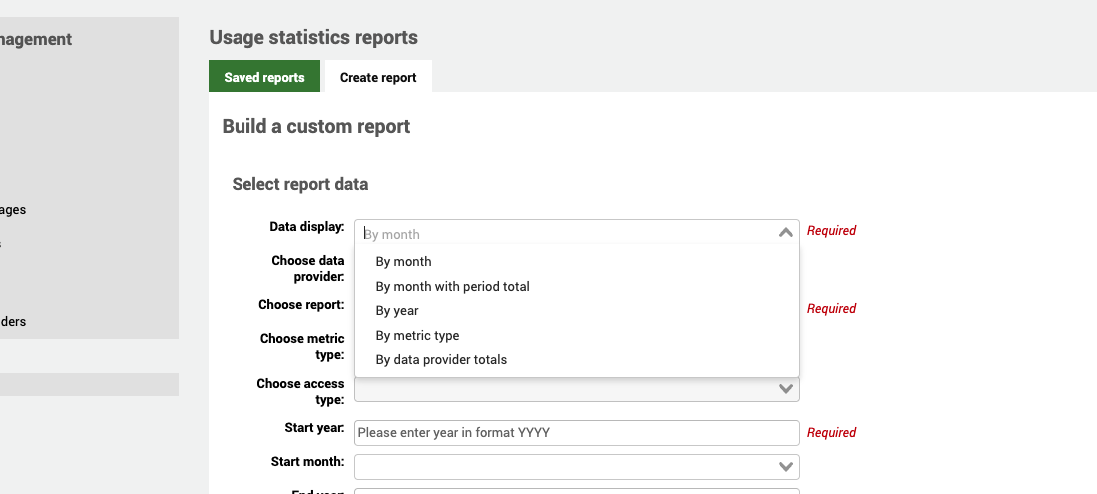
Data display (Required)
Depending on the nature of the data you are looking at, you have a number of data displays: both monthly and annual counts, with or without totals; counts by metric type, Total or Unique item requests. You can also use data provider totals to get a single overall count.
Choose data provider
You can specifically look at data for a single Data Provider (platform) by selecting the data provider from the dropdown list.
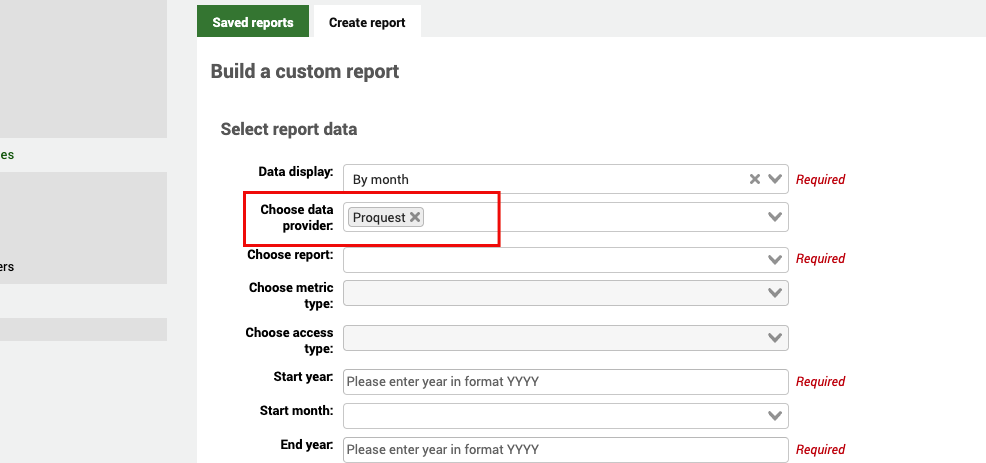
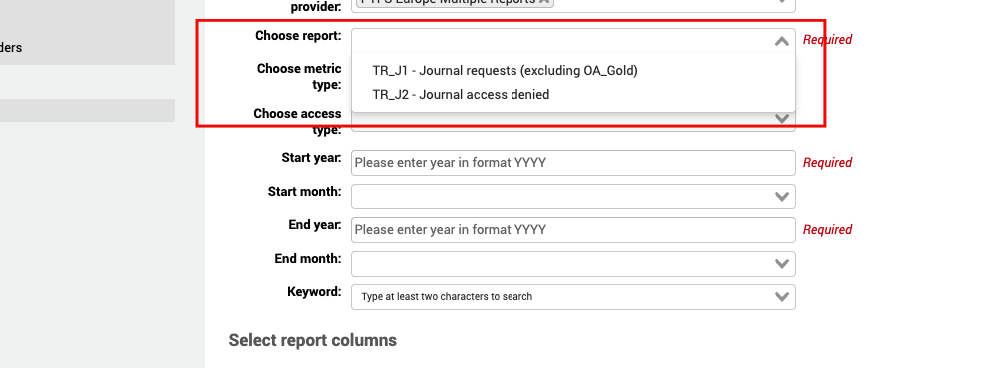
Choose report (Required)
Once you have selected a data provider, you can only select a report type that is in use in the data provider record. So, if the data provider supports TR_J1 and TR_J2 for example, these are the only report types you will see listed.
If you select the report type before the provider, this will limit the drop-down list of providers to those who support that report type.
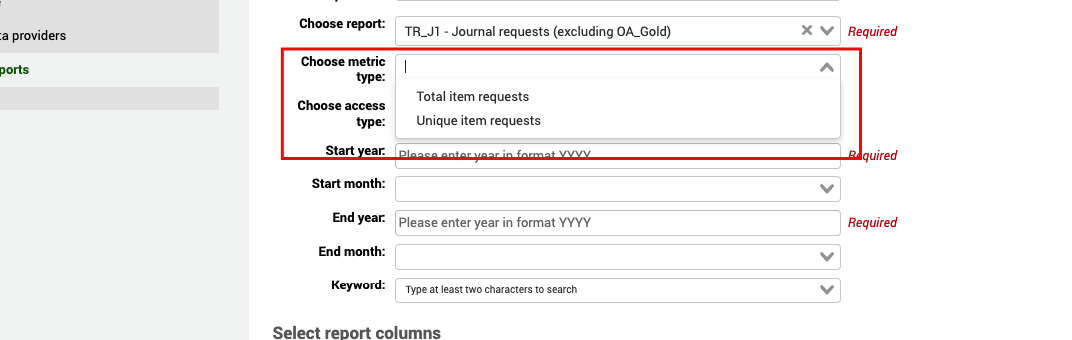
Choose metric type
The metric types which display depend on the report type you have selected. Some metric types only apply to certain report types. For example, TR_J1 supports Total Item Requests and Unique Item Requests whereas PR_P1 will give you Searches platform.
If you donât select a metric type, all metric types will be displayed in your report.
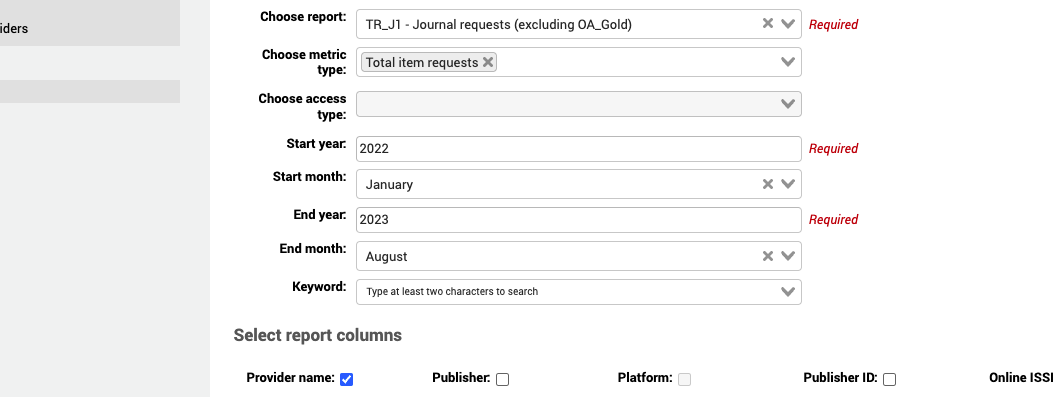
Choose access type
For some very specific reports (e.g. TR_J3 and TR_B3) the data is broken down further into access types. When you select one of these reports, you will see that the access type field becomes active and offers an option of Controlled and OA_Gold.
Start year (Required)
You must provide a start year for your report data.
Start month
You can (optionally) specify a month if you are trying to look at data for a specific period.
End year (Required)
You must provide an end year for your report data.
End month
You can (optionally) specify a month if you are trying to look at data for a specific period.
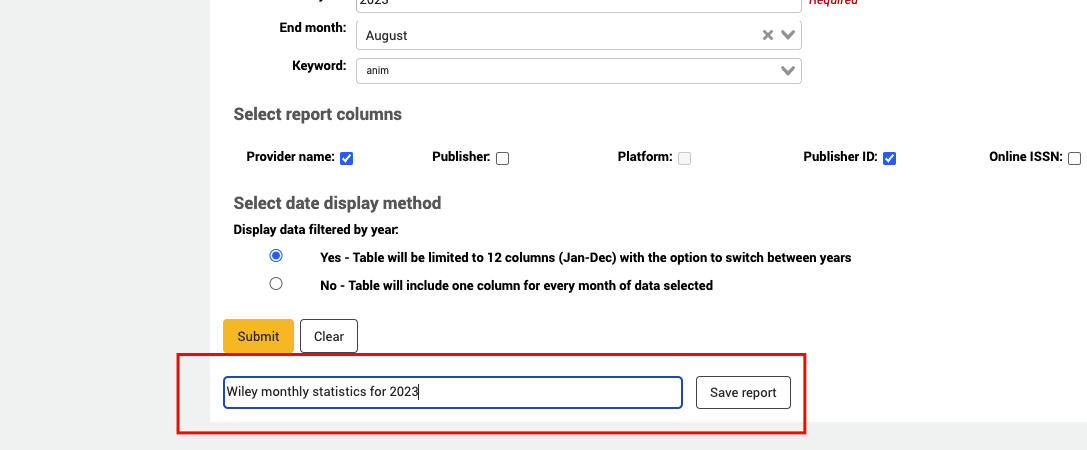
Keyword
Once you have selected a specific data provider, you can use the Keyword option to search for a specific title. This allows you to see statistics for a particular publication.

Select report columnsï
By default, the Provider name is output to your report but you can also include additional data which is included in your COUNTER report such as Publisher, DOI, etc.

Check the COUNTER documentation for information about all the COUNTER reports.
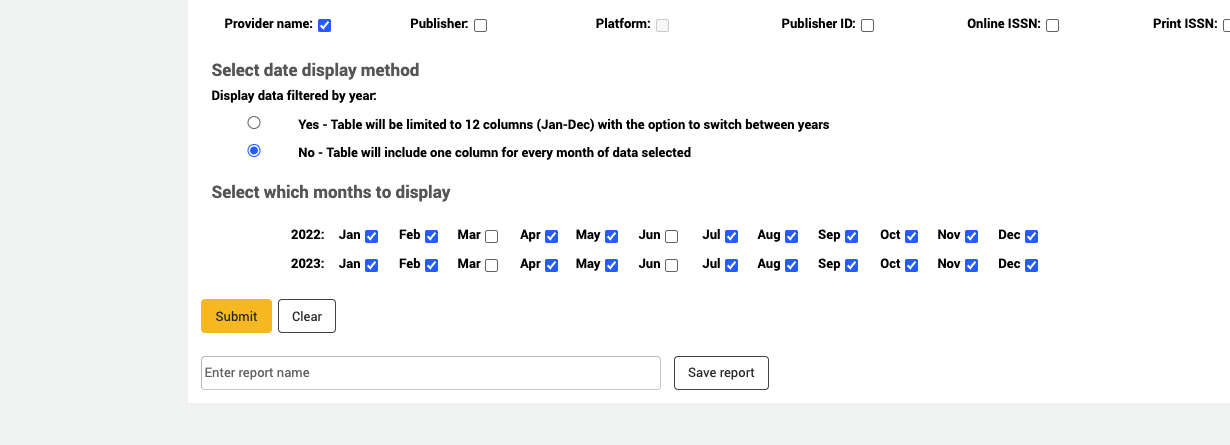
Select date display methodï
When set to Yes, the data will always be listed by a 12-month period from January to December. This is to make the report readable on the screen. On the report output, you will have the option to toggle by year if you have selected data for more than one year.
When set to No, you will have one column for every month selected. Obviously, if you have many months selected you may be required to use your scrollbar to navigate the results on the page.
You can save your report by entering a name and selecting âSave reportâ.
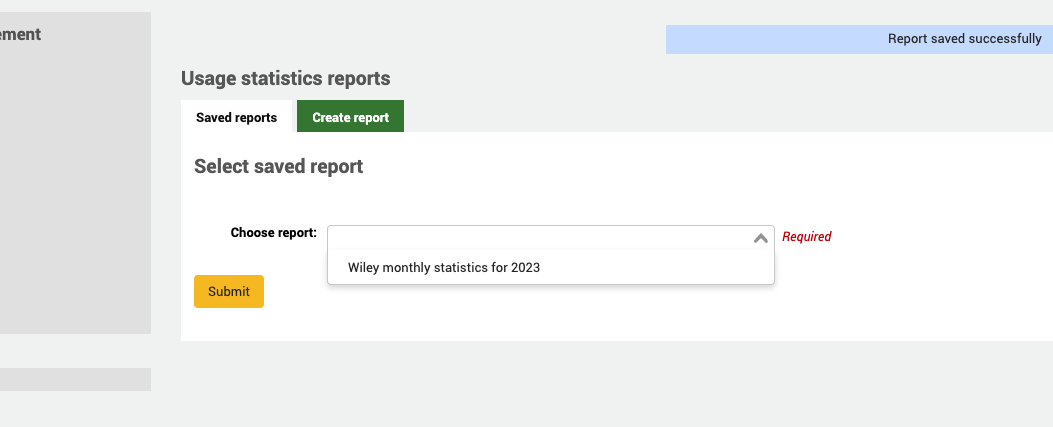
Saved reportsï
Once you have created a report, it will appear on the âSaved reportsâ tab for future use.
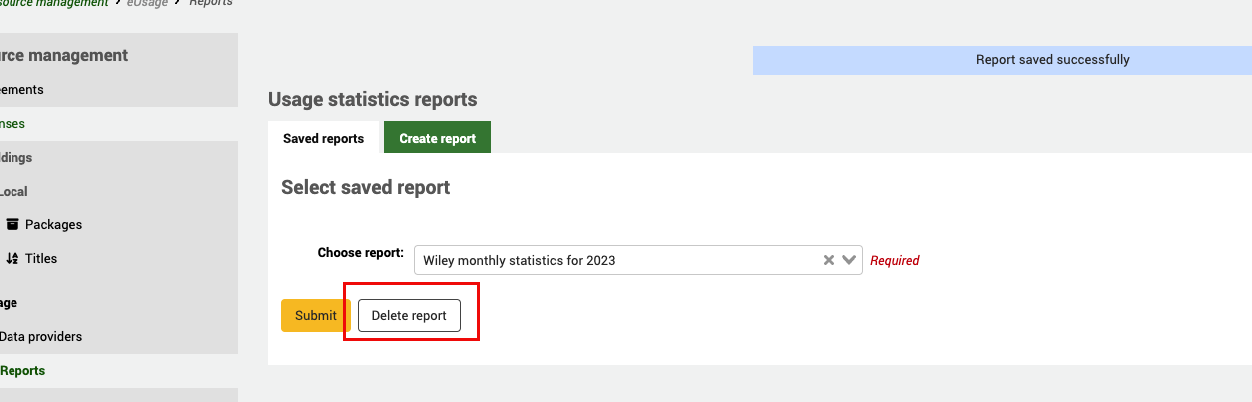
In order to Delete a saved report, use the Delete button on the Saved reports page once you have selected the report you would like to delete.
Once your report is set up select Submit to run the query. A report with data display set to Yes will look like this
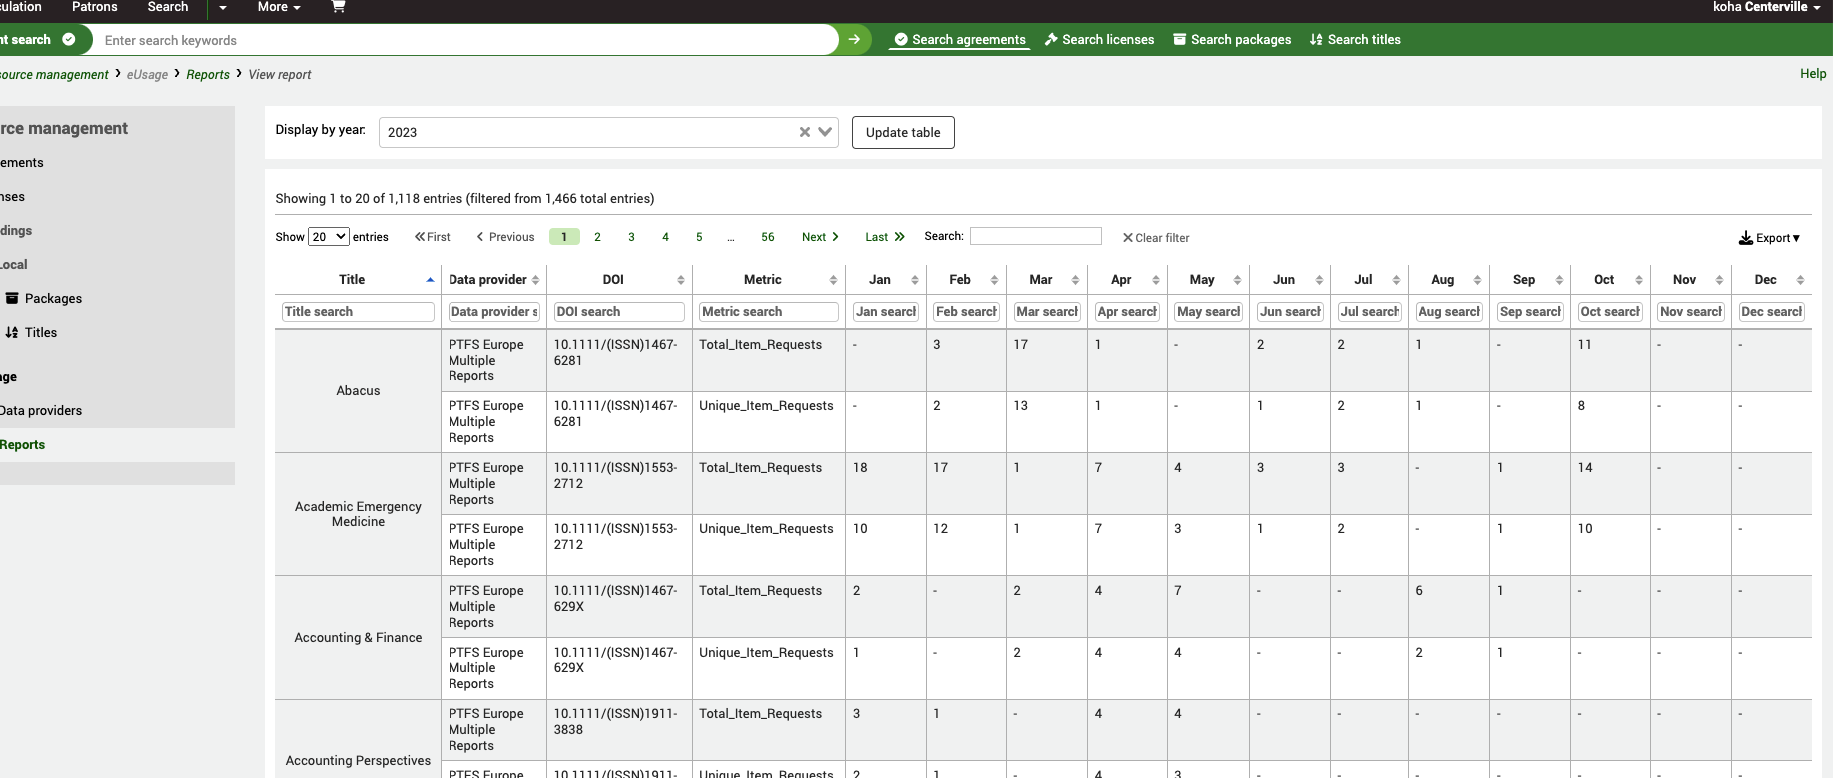
Take note of the âDisplay by yearâ toggle at the top. If there is more than one year, you can use this to update the table with data from previous years.
When you select No, you will be offered a list of months to select/deselect.
Because of the number of months selected the report may scroll off to the right of your page.
Tip
Make sure you have harvested the latest data from your provider before you run the report. You can either do this manually by clicking âRun nowâ in the data provider home screen, or you can use the harvesting cron job to automatically harvest data at regular intervals.
Built with Sphinx using a theme provided by Read the Docs.